World Cup logistics statistics: 15 Mind-Blowing Stats About Organizing It
The World Cup isn’t just the biggest sporting event—it’s one of the most complex logistical undertakings on the planet. From moving entire teams across continents to securing massive stadiums and accommodating millions of fans, the scale of operations is staggering. These 15 mind-blowing World Cup logistics statistics will give you a new appreciation for what it takes to make the World Cup happen.
1) 3.4 Million Tickets Sold (Russia 2018)
Russia 2018 sold more than 3.4 million tickets, a record for any single-country World Cup (FIFA). Managing this massive crowd meant coordinating entry, seating, transport, and safety across 12 stadiums. Each fan’s journey — from purchase to kickoff — represented a logistical success story in itself.
2) Over 3 Billion Global Viewers
The 2018 World Cup reached over 3.5 billion people worldwide (Reuters). Delivering that required thousands of cameras, satellite trucks, editors, translators, and tech specialists. Every second of broadcast — from Moscow to Mexico City — was the product of enormous coordination across time zones and languages.
3) $229 Billion – Qatar 2022’s Total Cost
Qatar’s 2022 World Cup became the most expensive in history, costing an estimated $229 billion (Forbes). Investments included seven new stadiums, an entire metro system, and dozens of hotels. The sheer scale redefined what financial and logistical planning means in global sport.
4) 32 Teams, 736 Players
Every tournament since 1998 has hosted 32 teams, meaning 736 players — plus coaching and medical staff — to transport, house, and train (FIFA). That’s over 1,500 people needing personalized logistics across 64 matches. Flights, meals, gear, and training sessions must align perfectly to keep teams performing at their best.
5) 80,000 Volunteers (Germany 2006)
Germany 2006 mobilized one of the largest volunteer forces in sports history — over 80,000 helpers (DW). They worked in transportation, hospitality, fan assistance, and translation. Without them, the tournament’s smooth operation would have been impossible.
6) 20,000+ Media Personnel
Covering the World Cup requires a small city of journalists — more than 20,000 media professionals from across the globe (BBC). They depend on dedicated media centers, high-speed networks, and secure credentials. FIFA’s media infrastructure ensures the story of every match reaches the world instantly.
7) 3,000+ Security Personnel per Match
Each World Cup match deploys more than 3,000 police, military, and private security officers (Reuters). They monitor crowds, manage entry points, and prevent potential threats. Maintaining safety for 80,000 fans per stadium is one of the toughest logistical tasks on Earth.

8) 1.5 Million Tourists (Brazil 2014)
Brazil’s World Cup in 2014 attracted over 1.5 million foreign tourists (Sports Illustrated). Managing accommodations, airport transfers, and public transport for so many visitors stretched local systems to their limits. Yet, it generated billions in tourism revenue and showcased Brazil’s hospitality.
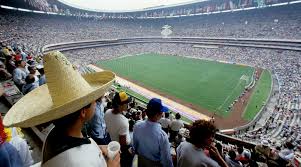
9) 12 Stadiums in 11 Cities (Russia 2018)
Russia hosted matches across 11 cities spanning nearly 2,000 miles apart (FIFA). Coordinating flights, train schedules, and accommodation for teams and fans required unprecedented national cooperation. It was a logistical symphony of timing and precision.
10) 180 Tons of Broadcast Equipment
Each venue required more than 180 tons of equipment for cameras, servers, and control rooms (FIFA). Over 37 cameras per match capture every detail. Behind every goal replay is a global broadcast team ensuring flawless coverage.
11) 64 Matches in 29 Days
Scheduling 64 matches across four weeks with no broadcast conflicts is an enormous challenge (New York Times). Every kickoff, rest day, and travel route must align perfectly. One delay can ripple across millions of viewers and transport systems worldwide.
12) 10,000+ Flights Tracked (Qatar 2022)
With Qatar’s compact geography, air traffic soared during the 2022 World Cup (Reuters). Over 10,000 charter, VIP, and media flights were tracked in real-time. Managing that density of aircraft required constant coordination between regional airports and security agencies.
13) 1.2 Million Containers of Food and Beverage
From sandwiches to soft drinks, stadiums serve over a million food containers during each tournament (BBC). Supply chains must meet international safety standards while feeding fans, media, and players simultaneously. Even hydration logistics are meticulously calculated by organizers.
14) 2,000+ Miles of Cables
Each venue installs thousands of miles of fiber-optic and power cables for media, lighting, and operations (FIFA). This digital backbone powers instant replays, VAR technology, and streaming to billions of viewers worldwide.
15) 7,000 Hours of Content Produced
Each tournament generates more than 7,000 hours of live footage, replays, and digital features (Sports Illustrated). From player interviews to behind-the-scenes documentaries, production crews work around the clock. The result is a global narrative that reaches billions of screens and hearts.
Conclusion
Behind every match-winning goal is a world-class logistical operation. These World Cup logistics stats reveal how technology, coordination, and human effort combine to make the tournament seamless for fans. While we celebrate the magic on the pitch, there’s an equally monumental performance happening behind the scenes — one that keeps the world’s biggest event running like clockwork.
How many people work to organize a World Cup?
Each tournament involves tens of thousands of staff, contractors, and volunteers, supported by millions of local workers and service providers (FIFA).
Which World Cup was the most expensive to organize?
Qatar 2022 holds the record at around $229 billion, largely due to infrastructure investments and new stadium construction (Forbes).
Suggested Internal Reads: 15 Statistical Oddities from 90+ Years of World Cup Matches · 15 Surprising Rules That Have Existed in Past World Cups · The Social Impact: 15 Ways the World Cup Changes Host Cities and Countries